An interactive, parameterized model of the climate response to CO2
emissions and other climate forcings. This is the work of Atul Jain at
the University of Illinois.
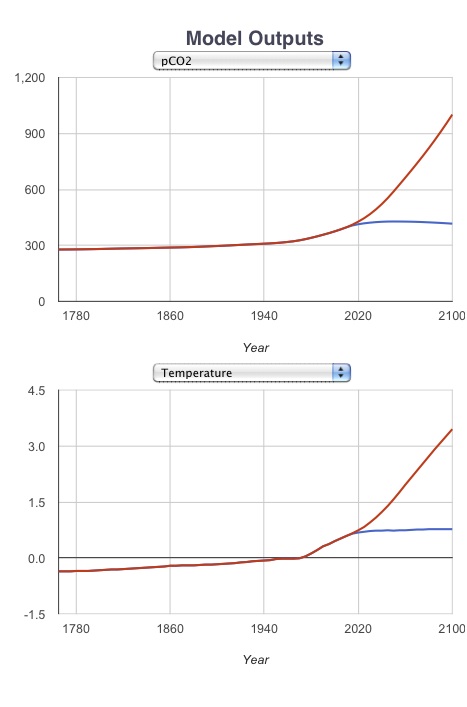
Contrasting atmospheric CO2 concentrations and temperature between the High business-as-usual scenario and a ramp-down 80% decrease by 2050 scenario.
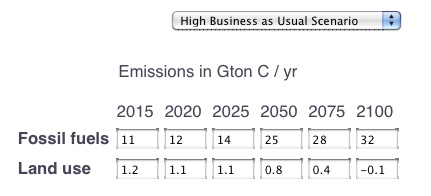
Choose one of the IPCC SRE scenarios as a starting point. The
CO2 emissions fluxes from industrial and land-use sources
are plotted in the upper left, and tabulated in boxes, as a function
of year, on the lower left.
Model outputs include atmospheric CO2, carbon emission rates, radiative forcings, temperature, and sea level.
You can compare two model runs by running the first, then selecting Save This Run to Background. The run will be saved on the plot, and you can superimpose a second by changing model options. Get rid of the backround plot by Deleting it.
| Find the changes in CO2 emissions that would be needed to stabilize the CO2 concentration or the temperature of the atmosphere at some value. |
| How much carbon do the land surface and the ocean take up or give off, relative to human emissions? |
| How sensitive is sea level to rates of CO2 emissions in the model? |
 |
The University of Chicago 5801 South Ellis Ave Chicago IL 60637 773.702.1234 |