Hubbert applied the method, in about 1956, to the time evolution of oil extraction from the continental U.S. (top option on the page). The other piece of information he needed was an estimate of the total amount of oil that would ever be extracted. With this, he predicted using the data up that time (1956) that the U.S. would reach peak oil production in the early 1970's. Alter the curve by changing the parameters, and see how much wiggle room Hubbert had to make this prediction.
Today, with respect to World oil production, we are in a postion not unlike Hubbert's, where uncertainty in the total extractable inventory of oil have some impact on how well can pin down the year of global peak oil.
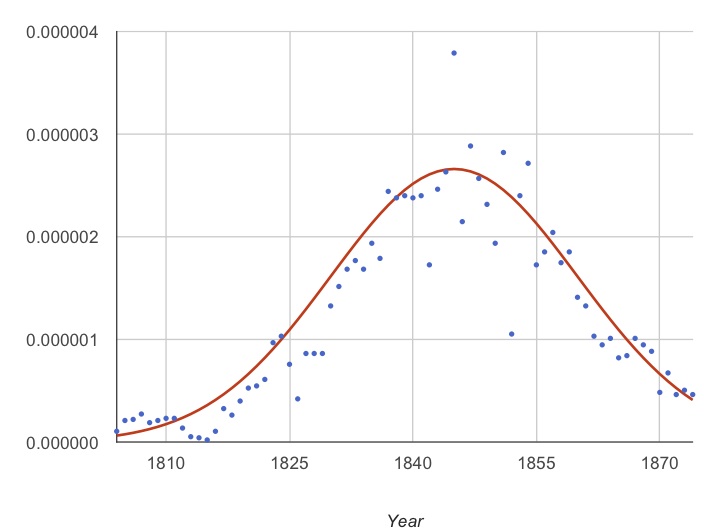
The Hubbert curve applied to Whale oil.
Then adjust the Peak Year, Peak Width (in years), and Total Reservoir Size (in Gton C). These three parameters determine the shape of the Hubbert curve. Tune the parameters to optimize the "eyeball fit" between the curve and the data.
| When does the model predict peak global oil production? |
| How much does it change the best-fit peak oil year when you change the global inventory of oil in the ground the model assumes? |
 |
The University of Chicago 5801 South Ellis Ave Chicago IL 60637 773.702.1234 |